Categories
Introduction to OpenStack Online Courses

Session 2: Understanding OpenStack

After a pretty basic Session 1, looking forward to focusing in more on OpenStack. We start off with some history and a look at the OpenStack Foundation.

OpenStack started in 2010 as a joint project between RackSpace (providing Swift) and NASA (providing Nova). The role of the OpenStack Foundation is described as:

to promote the global development, distribution, and adoption of the cloud operating system. It provides shared resources to grow the OpenStack cloud. It also enables technology vendors and developers to assist in the production of cloud software.

That’s a bit to abstract for me to understand… but anyway.. also mentioned is information on how to contribute and get help with OpenStack. I think https://ask.openstack.org/en/questions/ will come in very handy. As OpenStack is a community project hopefully I can find something to contribute here – https://wiki.openstack.org/wiki/How_To_Contribute.

We know start looking at the OpenStack Projects. Being aware of these projects and their maturity status is critical for operating an OpenStack deployment effectively.

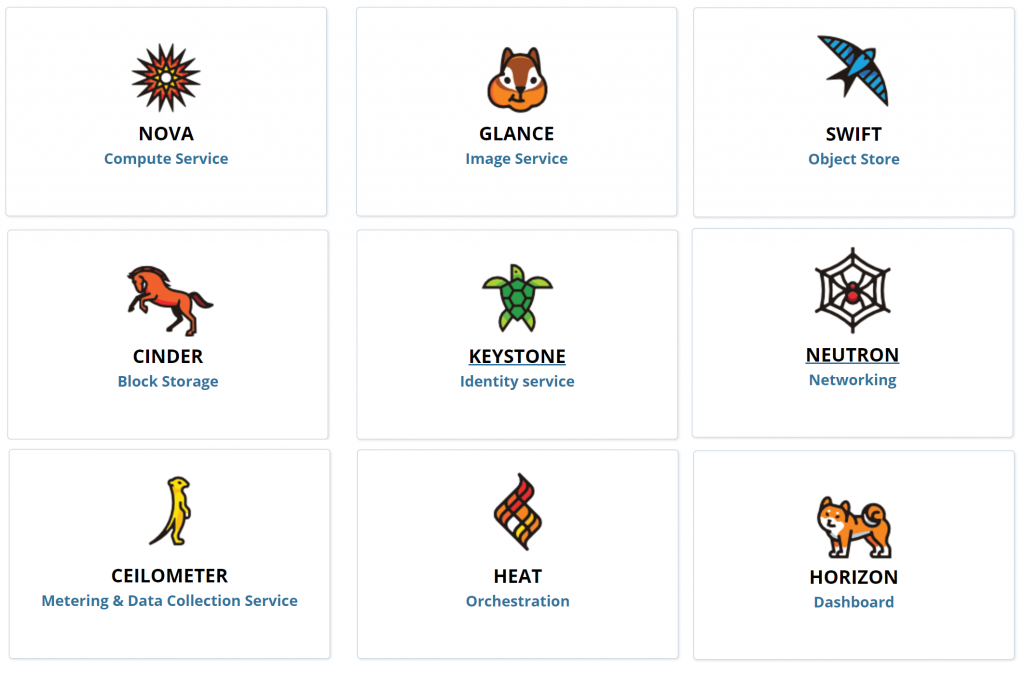
Core OpenStack Projects

There are some other project that have high adoptions rates (>50% of OpenStack deployments):

  • Heat – Orchestration of Cloud Services via code (text definitions) and also provides auto-scaling ala AWS CloudFormation
  • Horizon – OpenStack’s dashboard with web interface
  • Ceilometer – Metering and data collection service enabling metering, billing, monitoring and data driven operations

Other projects introduced in this session:

  • Trove – Database as a Service (ie: AWS RDS)
  • Sahara – Hadoop as a Service
  • Ironic – Bare metal provisioning (very good name!)
  • Zaqar – Messaging service with multi tenant queues, high availability, scalability, REST API and web-socket API
  • Manila – Shared File System service – Like running samba in the cloud
  • Designate – DNS as a Service (backed by either Bind or PowerDNS) – also integrates with Nova and Neutron for auto-generation of DNS record
  • Barbican – Secret and Key management
  • Magnum – Aims to enable the usage of Swarm, Kubernetes more seamlessly in OpenStack
  • Murano – Application catalogue
  • Congress – Policy as a Service

After introducing these core services the session delves into a little more detail on the key.

Nove Compute is arguably the most important components. It manages the lifecycle (spawning, scheduling and decommissioning) of all VMs on the platform. Nova is not the hypervisor, it interfaces to the hypervisor you are  using (Xen, KVM, VMware, vSphere) via an agent that is installed on the hypervisor. Nova should be deployed in a distributed fashion where some agents run at local work points and some server processes run on the management servers.

Neutron Networking allows users to define their own networking between VMs they have deployed. Two instances may be deployed on 2 separate physical clusters but the user wants the on the same subnet and broadcast network. Though this can’t be done at the physical level, Neutron’s software defined network enable a logical network to be define which transparently configures the underlying network infrastructure to provide that experience to the user. Neutron uses a pluggable architecture meaning most vendors will enable Neutrons SDNs. Neutron has an API that allows networks to be defined and configured.

Swift Object Storage provides highly scalable storage. It is analgous to AWS’s S3 service. Applications running on OpenStack can talk to a swift proxy which stores the data provided to them on multiple storage nodes. This makes it very fault tolerant. The swift proxy is able to make many parallel requests to storage nodes making scalability quite easy. The swift services can be interfaced with via a RESTful api.

Glance Image provides the ability to store virtual disk images. Glance should use Swift/Ceph as a scalable backend for storing the images. A list of ready to download images can be found here: https://docs.openstack.org/image-guide/obtain-images.html – Windows images are available (supported with Hyper-V and KVM hypervisors). An example of deploying an image to Glance (when using KVM):

gunzip -cd windows_server_2012_r2_standard_eval_kvm_20170321.qcow2.gz | 
glance image-create --property hypervisor_type=QEMU --name "Windows Server 2012 R2 Std Eval" 
--container-format bare --disk-format qcow2 --property os_type=windows

Cinder Block Storage is, in essence, the same as AWS Elastic Block Storage [EBS] whereby persistent volumes can be attached to VMs. Cinder can use Swift/Ceph (or linux LVM) as a backend for storage. Instance storage, without Cinder Block Storage is ephemeral.

Keystone Identity provides authentic and authorization services for OpenStack services. Keystone also provides the central repository for available services and their end points. Keystone also enables definition of Users, Roles that can be assigned to Projects (Tenants). Keystone uses MariaDB by default but can use LDAP (not sure if a DB backend is still required in that case).

Behind the core OpenStack services above – there are some other critical services (dependencies):

  • Time synchronization – OpenStack services depend on this for communication, in particular Keystone issues access tickets that are tied to timestamps
  • Database – MariaDB (by default) for Keystone is a critical services
  • Message Queue – Enable message passing between services – which given the RESTful communications is again critical

Following on from the brief overview of key components of OpenStack we look at the RESTful api – basically just stating that HTTP with JSON is prevalent. If one wanted to basically all OpenStack operations could be complete with cURL.

Horizon is the introduced as a web-based GUI alternative to using the RESTful APIs or the command line client. The command line client  can be configure to point to Keystone from which it will discover all the other available services (Nova, Neutron, Swift, Glance etc). The Horizon Dashboard distinguished between Administrators and Tenants but based on our initial testing.

That’s a wrap for, Session 3 we will start deploying OpenStack!

Categories
Introduction to OpenStack Online Courses

Session 1: From Virtualization to Cloud Computing

In looking for an online, at your own pace course for getting a foundation understanding of OpenStack I came across edx.org’s OpenStack course (LFS152x). The full syllabus can be downloaded here.

Out of this course I hope to get an understanding of:

  • The key components of OpenStack
  • Hands on experience via some practical work
  • A local lab environment for further learning
  • Some resources that I can go back to in the future (ie: best forums)
  • The history and future of OpenStack
  • The next steps for building expertise with OpenStack

The course kicks off in Session 1 with a bunch of introductory information (including a page or so on The Linux Foundation who run more project I use than I was aware).

After the introductory items we go over the evolution from physicals servers to virtualization to cloud and why each step has been take… which really boils down to efficiency and cost savings.

  • Physical servers suck because they take up space and power and are difficult to properly utilize (physical hosts alone generally operate at < 10% capacity)
  • Virtualization lacks self-service
  • Virtualization has limited scalability as it is manual
  • Virtualization is heavy -> every VM has its own kernel
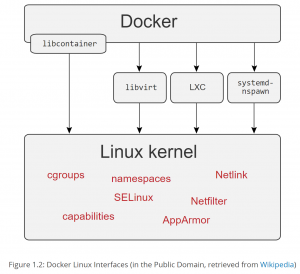
  • Containers are better than VMs by visualizing the operating system (many OS to 1 kernel)
  • Containers are also good because they remove a number of challenges along the deployment/development pipeline

Interestingly this introductory seems to focus in on containerization, describing what container images as the Application, User Space dependencies and Libraries required to run. Every running container has 3 components:

  1. Namespaces (network, mounts, PIDs) – provide isolation for processes in the container
  2. CGroups – reserve and allocate resources to containers
  3. Union file system – merge different filesystems into one, virtual filesystem (ie: overlayfs)

Some pros and cons of containers are discussed –  I am not sure about the security pros – versus VMs but I think the value provided by containerization has been well established.

Next up is some discussion on Cloud Computing. Though a lot of this stuff is fairly basic, its nice to review every now and then. The definition provided for Cloud Computing:

Cloud computing is an Internet-based computing that provides shared processing resources and data to computers and other devices on demand. It enables on-demand access to a shared pool of computing resources, such as networks, servers, storage, applications and services, which typically are hosted in third-party data centers.

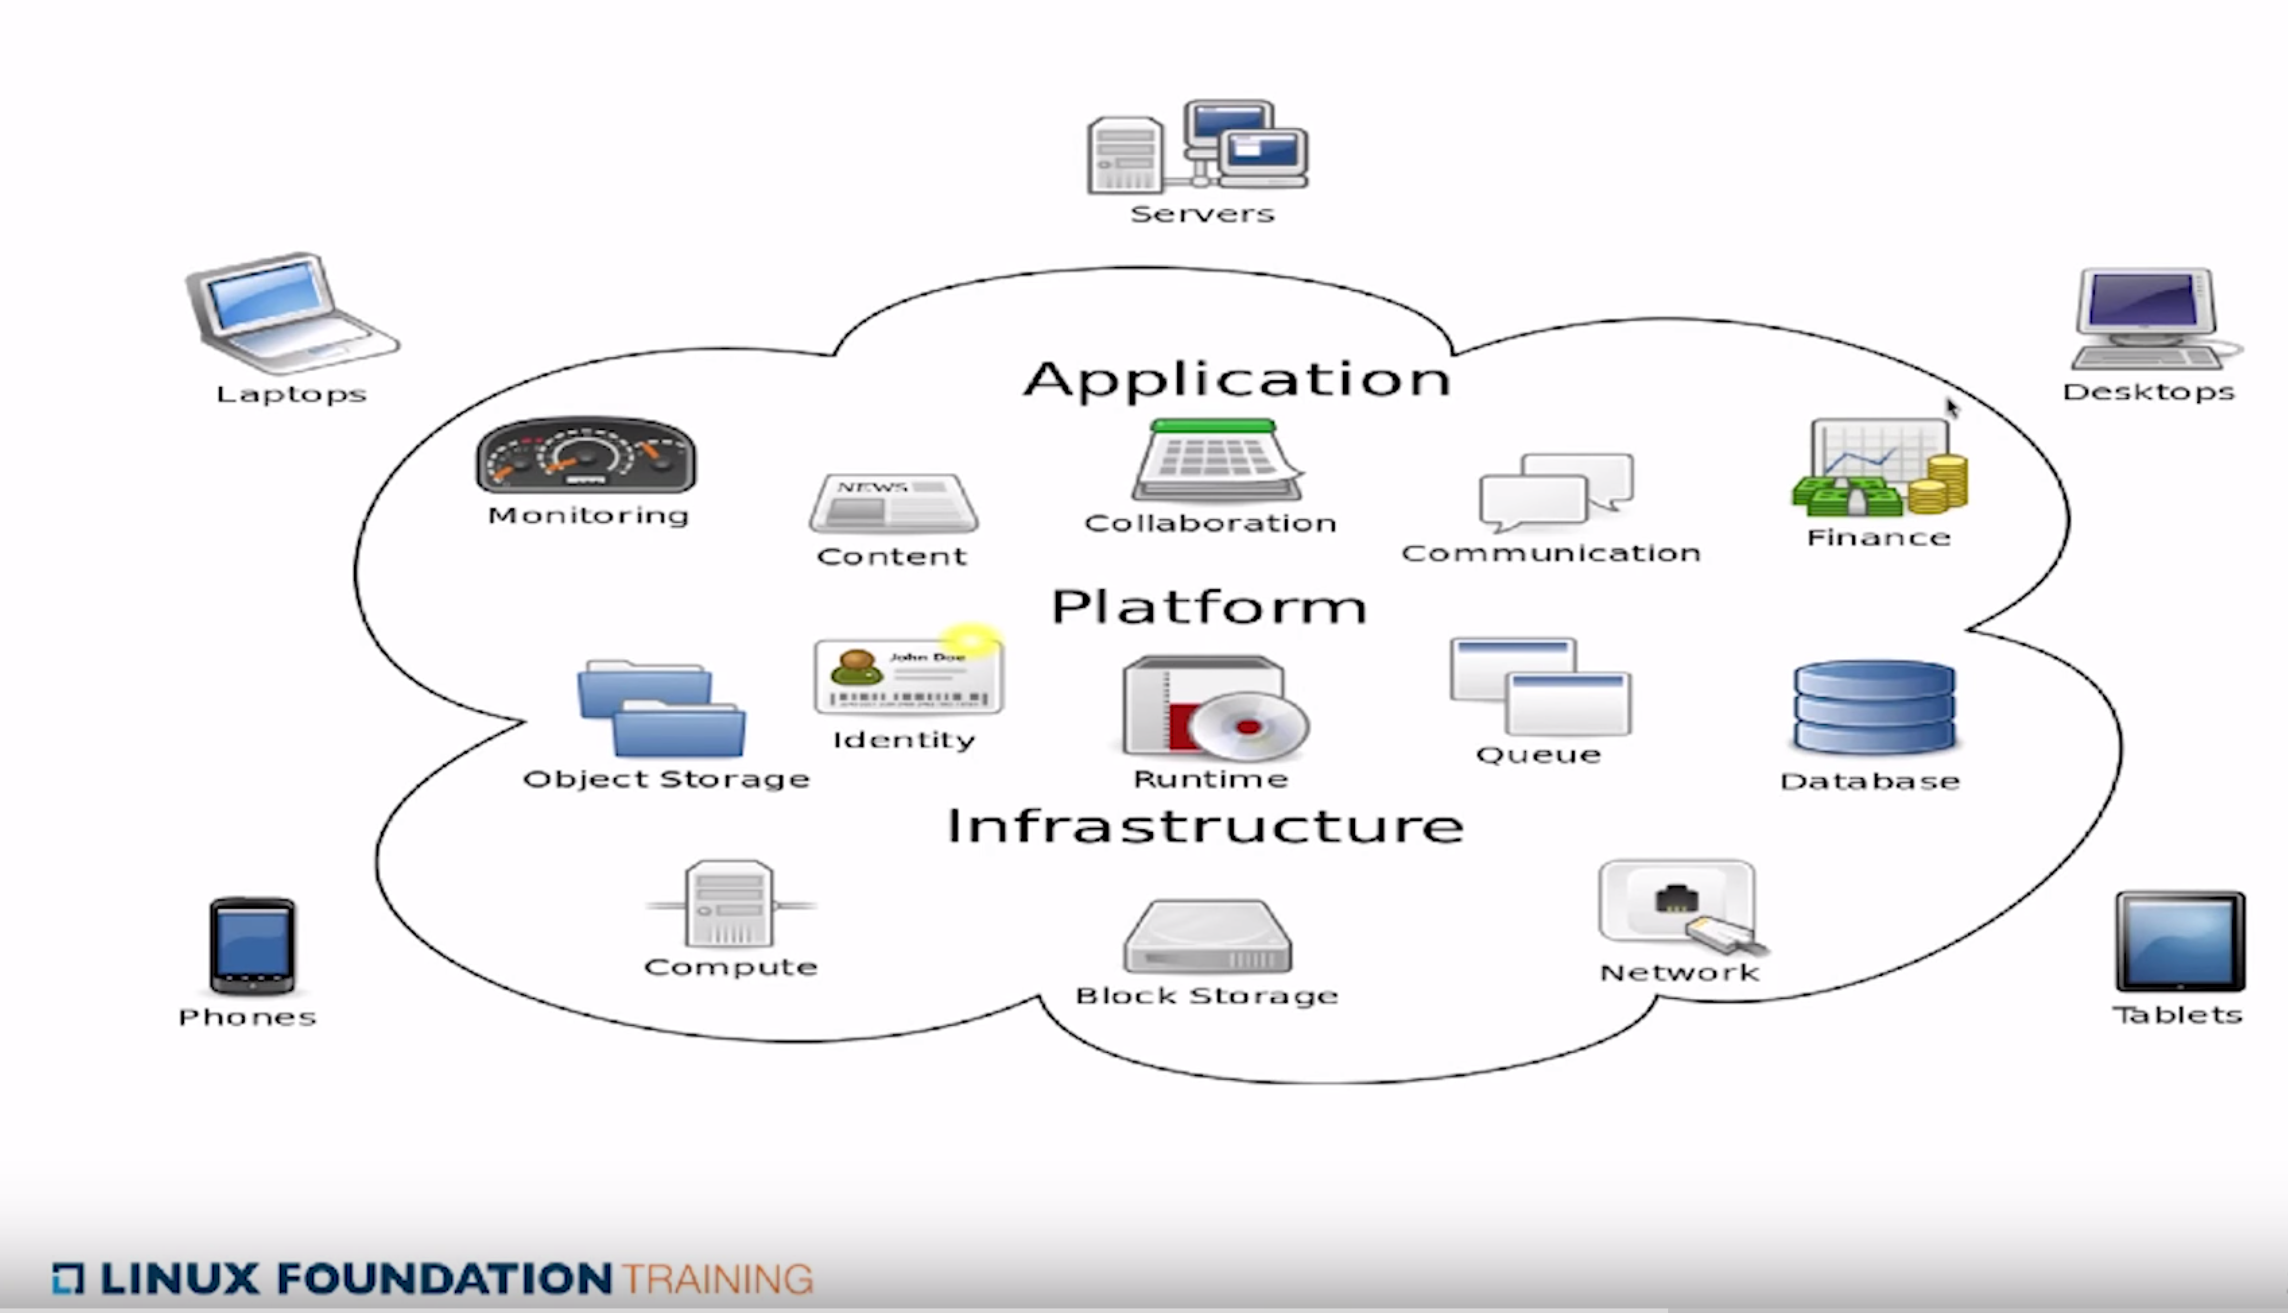
The differences between IaaS, PaaS and SaaS are covered, a decent diagram to spot the differences (with Application representing the Software as a Service category):

A great point mention is that “If you do not need scalability and self-service, you might be better off using virtualization.” – which in my experience is very true. For some clients the added complexity that comes with enabling self service and dynamic scalability are not used and the stability and relative simplicity of static virtual machines is a better solution.

We then run through an example of deploying a VM on AWS… with the conclusion that OpenStack is about the same and has a more developed API (not sure about that yet!).

Will move on to Session 2 and hopefully start digging into OpenStack more specifically!

Categories
Online Courses Scalable Microservices with Kubernetes

Deploying Microservices

So far the Kubernetes examples have been little more than what could be accomplished with Bash, Docker and Jenkins. No we shall look at how Kubernetes can be used for more effective management of application deployment and configuration. Enter Desired State.

Deployments are used to define our desired state then work with replica controllers to ensure desired state is met. A deployment is an abstraction from a pods.

Services are used to group pods and provide an interface to them.

Scaling is up next. Using the deployments configuration file updating the replicas field and running kubectl apply -f <file> is all that needs to be done! Well its not quite that simple. That scales the number of replica pods deployed to our kubernetes cluster. It does not change the amount of machine (VM/Physical) resources in the cluster. So… I would not really call this scaling :(.

Onto updating (patching, new version etc). There are two types of deployments, rollout and blue-green. Rollouts can be conducted by updating the deployment config (container->image) reference then running kubectl apply -f. This will automatically conduct a staged rollout.

OK so that’s the end of the course – it was not very deep, and did not cover anything like dealing with persistent layers. Nonetheless it was good to review the basics. Next step is to understand the architecture or our my application running on Kubernetes in AWS.

At first I read a number of threads stating that kubernetes does not support cross availability zone clusters in AWS. Cross availabilty zone clusters are supported on AWS: Kube-aws supports “spreading” a cluster across any number of Availability Zones in a given region. https://coreos.com/kubernetes/docs/latest/kubernetes-on-aws-render.html. With that in mind the following architecture is what I will be moving to:

kubernetes high level architecture
Kubernetes high level architecture

Instead of HA Proxy I will stick with out existing NGINX reverse proxy.

Categories
Online Courses Scalable Microservices with Kubernetes

Introduction To Microservices and Containers with Docker

After running through some unguided examples of Kubernetes I still don’t feel confident that I am fully grasping the correct ways to leverage the tool. Fortunately there is a course on Udacity that seems to be right on topic…Scalable Microservices with Kubernetes.

The first section, Introduction to Microservices references a number of resources including The Twelve-Factor App which is a nice little manifesto.

The tools used in the course are:

  • Golang – A newish programming language from the creators for C (at Google)
  • Google cloud shell – Temp VM preloaded with the tools need to manage our clusters
  • Docker – to package, distribute, and run our application
  • Kubernetes – to handle management, deployment and scaling of application
  • Google Container Engine – GKE is a hosted Kubernetes service

The Introduction to Microservices lesson goes on to discuss the benefits for microservices and why they are being used (boils down to faster development). The increased requirements for automation with microservices are also highlighted.

We then go on to set up GCE (Google Compute Engine), creating a new Project and enabling the Compute Engine and Container Engine APIs. To manage the Google Cloud Platform project we used the Google Cloud Shell. On the Google Cloud Shell we did some basic testing and installation of GoLang, I am not sure what the point of that was as the Cloud Shell is just a management tool(?).

Next step was a review of

All pretty straight forward — On to Building Containers with Docker.

Now we want to Build, Package, Distribute and Run our code. Creating containers is easy with Docker and that enables us to be more sure about the dependencies and run environment of our microservices.

Part 1 – Spin up a VM:

# set session zone
gcloud config set compute/zone asia-east1-c
# start instance
gcloud compute instances create ubuntu \
--image-project ubuntu-os-cloud \
--image ubuntu-1604-xenial-v20160420c
# login
gcloud compute ssh ubuntu 
# note that starting an instance like this make is open to the world on all ports

After demonstrating how difficult it is to run multiple instances/versions of a service on an OS the arguments for containers and the isolation they enable we brought forth. Process(kind of), Package, Network, Namespace etc. A basic Docker demo was then conducted, followed by creating a couple of Dockerfiles, building some images and starting some containers. The images where then pushed to a registry with some discussion on public and private registries.

Categories
Online Courses Scalable Microservices with Kubernetes

Intro to Kubernetes

OK- now we are getting to the interesting stuff. Given we have a microservices architecture using Docker, how do we effectively operate our service. The services must include production environments, testing, monitoring, scaling etc.

 Problems/Challenges with microservices – organisational structure, automation requirements, discovery requirements.

We have seen how to package up a single service but that is a small part of the operating microservices problem. Kubernetes is suggested as a solution for:

  • App configuration
  • Service Discovery
  • Managing updates/Deployments
  • Monitoring

Create a cluster (ie: CoreOS cluster) and treat is as a single machine.

Into a practical example.

# Initate kubernetes cluster on GCE
gcloud container clusters create k0
# Launch a single instance
kubectl run nginx --image=nginx:1.10.0
# List pods
kubectl get pods
# Expose nginx to the world via a load balancer provisioned by GCE
kubectl expose deployment nginx --port 80 --type LoadBalancer
# List services
kubectl get services

Kubernetes cheat sheet

Next was a discussion of the Kubernetes components:

  • Pods (Containers, volumes, namespace, single ip)
  • Monitoring, readiness/health checks
  • Configmaps and Secrets
  • Services
  • Lables

Creating secrets:

# Initate kubernetes cluster on GCE
# create secrets for all files in dir
kubectl create secret generic tls-certs --from-file=tls/
# describe secrets you have just created
kubectl describe secrets tls-certs
# create a configmap
kubectl create configmap nginx-proxy-conf --from-file=nginx/proxy.conf
# describe the configmap just created
kubectl describe configmap nginx-proxy-conf

Now that we have our tls-secrets and nginx-proxy-conf defined in the kubernetes cluster, they must be exposed to the correct pods. This is accomplished within the pod yaml definition:

volumes:
    - name: "tls-certs"
      secret:
        secretName: "tls-certs"
    - name: "nginx-proxy-conf"
      configMap:
        name: "nginx-proxy-conf"
        items:
          - key: "proxy.conf"
            path: "proxy.conf"

In production you will want expose pods using services. Sevices are a persistent endpoint for pods. If pods has a specific label then they will automatically be added to the correct service pool when confirmed alive. There are currently 3 service types:

    • cluster ip – internal only
    • NodePort – each node gets an external ip that is accessible
    • LoadBalance – A load balancer from the cloud service provider (GCE and AWS(?) only)

Accessing a service using NodePort:

# Initate kubernetes cluster on GCE
# create a service
kubectl create -f ./services/monolith.yaml
kind: Service
apiVersion: v1
metadata:
  name: "monolith"
spec:
  selector:
    app: "monolith"
    secure: "enabled"
  ports:
    - protocol: "TCP"
      port: 443
      targetPort: 443
      nodePort: 31000
  type: NodePort
# open the nodePort port to the world on all cluster nodes
gcloud compute firewall-rules create allow-monolith-nodeport --allow=tcp:31000
# list external ip of compute nodes
gcloud compute instances list
NAME                               ZONE          MACHINE_TYPE   PREEMPTIBLE  INTERNAL_IP  EXTERNAL_IP      STATUS
gke-k0-default-pool-0bcbb955-32j6  asia-east1-c  n1-standard-1               10.140.0.4   104.199.198.133  RUNNING
gke-k0-default-pool-0bcbb955-7ebn  asia-east1-c  n1-standard-1               10.140.0.3   104.199.150.12   RUNNING
gke-k0-default-pool-0bcbb955-h7ss  asia-east1-c  n1-standard-1               10.140.0.2   104.155.208.48   RUNNING

Now any request to those EXTERNAL_IPs on port 31000 will be routed to pods that have label “app=monolith,secure=enabled” (as defined in the service yaml)

# get pods meeting service label definition
kubectl get pods -l "app=monolith,secure=enabled"
kubectl describe pods secure-monolith

Okay – so that, like the unguided demo I worked through previously was very light on. I am still not clear on how I would many a microservices application using the kubernetes tool. How do I do deployments, how to I monitor and alert, how do I load balance (if not in google cloud), how to I do service discovery/enrollment. Theres one more lesson to go in the course, so hopefully “Deploying Microservices” is more illuminating.

Categories
ITOps

Testing Kubernetes and CoreOS

In the previous post I described some the general direction and ‘wants’ for the next step of our IT Ops, summarised as:

Want Description
Continuous Deployment We need to have more automation and resiliency in our deployment, without adding our own code that needs to be changes when archtecture and service decencies change.
Automation of deployments Deployments, rollbacks, services discovery, easy local deployments for devs
Less time on updates Automation of updates
Reduced dependence on config management (puppet) Reduce number of puppet policies that are applied hosts
Image Management Image management (with immutable post deployment)
Reduce baseline work for IT staff IT staff have low baseline work, more room for initiatives
Reduce hardware footprint There can be no increase in hardware resource requirements (cost).

Start with the basics

Lets start with the simple demo deployment supplied by the CoreOS team.

https://coreos.com/kubernetes/docs/latest/kubernetes-on-vagrant.html

That set up was pretty straight forward (as supplied demos usually are).  Simple verification that the k8s components are up and running:

vagrant global-status 
#expected output assuming 1 etcd, 1 k8s controller and 2 k8s worker as defined in config.rb
id name provider state directory
----------------------------------------------------------------------------------------------------------
2146bec e1 virtualbox running VirtualBox VMs/coreos-kubernetes/multi-node/vagrant
87d498b c1 virtualbox running VirtualBox VMs/coreos-kubernetes/multi-node/vagrant
46bac62 w1 virtualbox running VirtualBox VMs/coreos-kubernetes/multi-node/vagrant
f05e369 w2 virtualbox running VirtualBox VMs/coreos-kubernetes/multi-node/vagrant

#set kubctl config and context
export KUBECONFIG="${KUBECONFIG}:$(pwd)/kubeconfig"
kubectl config use-context vagrant-multi
kubectl get nodes
#expected output
NAME STATUS AGE
172.17.4.101 Ready,SchedulingDisabled 4m
172.17.4.201 Ready 4m
172.17.4.202 Ready 4m

kubectl cluster-info
#expected output
Kubernetes master is running at https://172.17.4.101:443
Heapster is running at https://172.17.4.101:443/api/v1/proxy/namespaces/kube-system/services/heapster
KubeDNS is running at https://172.17.4.101:443/api/v1/proxy/namespaces/kube-system/services/kube-dns
kubernetes-dashboard is running atvagran       

*Note: It can take some time (5 mins or longer if core-os is updating) for the kubernetes cluster to become available. To see status, vagrant ssh c1 (or w1/w2/e1) and run journalctl -f (following service logs).

Accessing the kubernetes dashboard requires tunnelling, which if using the vagrant set up can be accomplished with: https://gist.github.com/iamsortiz/9b802caf7d37f678e1be18a232c3cc08 (note, that is for single node, if using multinode then change line 21 to:

vagrant ssh c1 -c "if [ ! -d /home/$USERNAME ]; then sudo useradd $USERNAME -m -s /bin/bash && echo '$USERNAME:$PASSWORD' | sudo chpasswd; fi"

Now the dashboard can be access on http://localhost:9090/.

Now lets to some simple k8s examples:

Create a load balanced nginx deployment:

# create 2 containers from nginx image (docker hub)
kubectl run my-nginx --image=nginx --replicas=2 --port=80
# expose the service to the internet
kubectl expose deployment my-nginx --target-port=80 --type=LoadBalancer
# list service nodes
kubectl get po
# show service info
kubectl get service my-nginx
kubectl describe service/my-nginx

First interesting point… with simple deployment above, I have already gone awry. Though I have 2 nginx containers (presumably for redundancy and load balancing), they have both been deployed on the same worker node (host). Lets not get bogged down now — will keep working through examples which probably cover how to ensure redundancy across hosts.


1
2
# Delete the service, removes pods and containers
kubectl delete deployment,service my-nginx

Reviewed config file (pod) options: http://kubernetes.io/docs/user-guide/configuring-containers/

Deploy demo application

https://github.com/kubernetes/kubernetes/blob/release-1.3/examples/guestbook/README.md

  1. create service for redis master, redis slaves and frontent
  2. create a deployment for redis master, redis slaves and frontend

Pretty easy.. now how do we get external traffic to the service? Either NodePort’s, Loadbalancers or ingress resource (?).

Next lets look at how to extend Kubernetes to

Categories
ITOps

Why look at Kubernetes and CoreOS

We are currently operating a service oriented architecture that is ‘dockerized’ with both host and containers running CentOS 7 when deployed straight on top of ec2 instances. We also have a deployment pipline with beanstalk + homegrown scripts. I imagine our position/maturity is similar to a lot of SMEs, we have aspirations of being on top of new technologies/practices but are some where in between old school and new school:

Old School New School
IT and Dev separate Devops (Ops and Devs have the same goals and responsibilities)
Monolithic/Large services Microservices
Big Releases Continuous Deployment
Some Automation Almost total automation with self-service
Static scaling Dynamic scaling
Config Management Image management (with immutable deployments)
IT staff have a high baseline work IT staff have low baseline work, more room for initiatives

This is not about which end of this incomplete spectrum is better… we have decided that for our place in the world, moving further the left is desirable. I know there are a lot of experienced IT operators that take this view:

Why CoreOS for Docker Hosts?

CoreOS: A lightweight Linux operating system designed for clustered deployments providing automation, security, and scalability for your most critical applications – https://coreos.com/why/

Our application and supporting services run in docker, there should not be any dependencies on the host operating system (apart from the docker engine and storage mounts).

Some questions I ask myself now:

  • Why do I need to monitor for and stage deployments of updates?
  • Why am I managing packages on a host OS that could be immutable (like CoreOS is, kind of)?
  • Why am I managing what should be homogeneous machines with puppet?
  • Why am I nursing host machines back to health when things go wrong (instead of blowing them away and redeploying)?
  • Why do I need to monitor SE Linux events?

I want a Docker Host OS that is/has:

  • Smaller, Stricter, Homogeneous and Disposable
  • Built in hosts and service clustering
  • As little management as possible post deployment

CoreOS looks good for removing the first set of questions and sufficing the wants.

Why Kubernetes?

Kubernetes: “A platform for automating deployment, scaling, and operations of application containers across clusters of hosts” – http://kubernetes.io/docs/whatisk8s/

Some questions I ask myself now:

  • Should my deployment, monitoring and scaling completely separate or be a platform?
  • Why do I (IT ops) still need to be around for prod deployments (no automatic success criteria for staged deploys and not automatic rollback)?
  • Why are our deployment scripts so complex and non-portable
  • Do I want a scaling solution outside of AWS Auto-Scaling groups?

I want a tool/platform to:

  • Streamline and rationalise our complex deployment process
  • Make monitoring, scaling and deployment more manageable without our lines of homebaked scripts
  • Generally make our monitoring, scaling and deployment more able to meet changing requirements

Kubernetes looks good for removing the first set of questions and sufficing the wants.

Next steps

  • Create a CoreOS cluster
  • Install Kubernetes on the cluster
  • Deploy an application via Kubernetes
  • Assess if CoreOS and Kubernetes take us in a direction we want to go
Categories
ITOps

Monitoring client side performance and javascript errors

The rise of single page apps (ie AngularJS) present some interesting problems for Ops. Specifically, the increased dependence on browser executed code means that real user experience monitoring is a must.

apm_logos

To that end I have reviewed some javascript agent monitoring solutions:

The solution/s must have the following requirements:

  • Must have:
    • Detailed javascript error reporting
    • Negligible performance impact
    • Real user performance monitoring
    • Effective single page app (AnglularJS support)
    • Real time alerting
  • Nice to have:
    • Low cost
    • Easy to deploy and maintain integration
    • Easy integration with tools we use for notifications (icinga2, Slack)

As our application is a single page Angular app, New Relic Browser requires that we pay US$130 for any single page app capability. The JavaScript error detection was not very impressive as uncaught exceptions outside of the angular app were not reported without angular integration.

Google Analytics with custom event push does not have any real time alerting which disqualifies it as an Ops solution.

AppDynamics Browser was easy to integrate, getting javascript error details in the console was straight forward but getting those errors to communication tools like slack was surprisingly difficult. Alerts are based on health checks which are breaking of metric thresholds – so I can send an alert saying there was more than 0 javascript errors in the last minute. But no details about the error and no direct link to the error.

Sentry.io simple to add monitoring, simple to get alerting with click through to all the javascript error info. No performance monitoring.

Conclusion sticking to the Unix philosophy, using sentry.io for javascript error alerting and AppDynamics Browser Lite for performance alerting. Both have free levels to get started (ongoing, not just 30 day trial).

Categories
ITOps

Getting started with Gatling – Part 2

With the basics of Simulations, Scenarios, Virtual Users, Sessions, Feeders, Checks, Assertions and Reports down –  it’s time to think about what to load test and how.

Will start with a test that tries to mimic the end user experience. That means that all the 3rd party javascript, css, images etc should be loaded. It does not seem reasonable to say our loadtest performance was great but none of our users will get a responsive app because of all those things we depend on (though, yes, most of it will likely already be cached by the user). This increases the complexity of the simulation scripts as there will be lots of additional resource requests cluttering things up. It is very important for maintainability to avoid code duplication and use the singleton object functionality available.

Using the recorder

As I want to include CDN calls, I tried the recorder’s ‘Generate CA’ functionality. This is supposed to generate certs on the fly for each CN. This would be convenient as I could just trust a locally generated CA and not have to track down and trust all sources. Unfortunately I could not get the recorder to generate its own CA, and when using a local CA generated with openssl I could not feed the CA password to the recorder. I only spent 15 mins trying this until reverting to the default self signed cert. Reviewing Firefox’s network panel (Firefox menu -> Developer -> Network ) shows any blocked sources which can then be visited directly and trusted with our fake cert (there are some fairly serious security implications of doing this, I personally only use my testing browser (firefox) with these types of proxy tools and never for normal browsing).

The recorder is very handy for getting the raw code you need into the test script, it is not a complete test though. Next up is:

  1. Dealing with authentication headers –  The recorded simulation does not set the header based on response from login attempt
  2. Requests dependent on the previous response – The recorder does not capture this dependency it only see the raw outbound requests so there will need to be consideration on parsing results
  3. Validating responses

Dealing with authentication headers

The Check API is used for verifying that the response to a request matches expectations and capturing some elements in it.

After half an hour or so of playing around the Check API, it is behaving as I want thanks to good, concise doc.

.exec(http("login-with-creds")
   .post("/cm/login")
   .headers(headers_14)
   .body(RawFileBody("test_user_creds.txt"))
   .check(headerRegex("Set-Cookie", "access_token=(.*);Version=*").saveAs("auth_token"))

The “.check” is looking for the header name “Set-Cookie” then extracting the auth token using a regex and finally saving the token as a key called auth_token.

In subsequent requests I need to include a header containing this value, and some other headers. So instead of listing them out each time a function makes things much neater:

def authHeader (auth_token:String):Map[String, String] = {
   Map("Authorization" -> "Bearer ".concat(auth_token),
       "Origin" -> baseURL)
} 
//...
http("list_irs")
   .get(uri1 + "/information-requests")
   .headers(authHeader("${auth_token}")) // providing the saved key value as a string arg

Its also worth noting that to ensure that all this was working as expected I modified /conf/logback.xml to output all HTTP request response data to stdout.


Requests dependent on the previous response

With many modern applications, the behaviour of the GUI is dictated by responses from an API. For example, when a user logs in, the GUI requests a json file with all (max 50) of the users open requests. When the GUI received this, the requests are rendered. In many cases this rendering process involves many more HTTP requests that depending on the time and state of the users which may vary significantly. So… if we are trying to imitate end user experience instead of requesting the render info for the same open requests all of the time, we should parse the json response and adjust subsequent requests accordingly. Thankfully gatling allows for the use of JsonPath. I got stuck trying to get all of the id vals out of a json return and then create requests for each of them. I had incorrectly assumed that the EL Gatling provided ‘random’ function could be called on a vector. This meant I thought the vector was ‘undefined’ as per the error message. The vector was in fact as expected which was clear by printing it.

//grabs all id values from the response body and puts them in a vector accessible via "${answer_ids}" or sessions.get("answer_ids")
http("list_irs")
.get(uri1 + "/information-requests")
.headers(authHeader("${auth_token}")).check(status.is(200), jsonPath("$..id").findAll.saveAs("answer_ids")) 
//....
//prints all vaules in the answer_ids vector
.exec(session => {
    val maybeId = session.get("answer_ids").asOption[String]
    println(maybeId.getOrElse("no ids found"))
    session
})

To run queries with all of the values pulled out of the json response we can use the foreach component. Again got stuck for a little while here. Was putting the foreach competent within an exec function, where (as below) it should be outside of an exec and reference a chain the contains an exec.

val answer_chain = exec(http("an_answer")
    .get(uri1 + "/information-requests/${item}/stores/answers")
    .headers(authHeader("${auth_token}")).check(status.is(200)))
//...
val scn = scenario("BasicLogin")
/...
.exec(http("list_irs")
    .get(uri1 + "/information-requests")
    .headers(authHeader("${auth_token}")).check(status.is(200), jsonPath("$..id").findAll.saveAs("answer_ids"))),
.foreach("${answer_ids}","item") { answer_chain }

Validating responses

What do we care about in responses?

  1. HTTP response headers (generally expecting 200 OK)
  2. HTTP response body contents – we can define expectations based on understanding of app behaviour
  3. Response time – we may want to define responses taking more than 2000ms as failures (queue application performance sales pitch)

Checking response headers is quite simple and can be seen explicitly above in .check(status.is(200). In fact, there is no need for 200 checks to be explicit as “A status check is automatically added to a request when you don’t specify one. It checks that the HTTP response has a 2XX or 304 status code.”checks.

HTTP response body content checks are valuable for ensuring the app behaves as expected. They also require a lot of maintenance so it is important to implement tests using code reuse where possible. Gatling is great for this as we can use the scala and all the power that comes with it (ie: reusable objects and functions across all tests).

Next up is response time checks. Note that these response times are specific to the HTTP layer and do not infer a good end user experience. Javascript and other rendering, along with blocking requests mean that performance testing at the HTTP layer is incomplete performance testing (though it is the meat and potatoes).
Gatling provides the Assertions API to conduct checks globally (on all requests). There are numerous scopes, statistics and conditions to choose from there. For specific operations, responseTimeInMillis and latencyInMillis are provided by Gatling – responseTimeInMillis includes the time is takes to fully send the request and fully receive the response (from the test host). As a default I use responseTimeInMillis as it has slightly higher coverage as a test.

These three verifications/tests can be seen here:

package mwc_gatling
import scala.concurrent.duration._
import io.gatling.core.Predef._
import io.gatling.http.Predef._
import io.gatling.jdbc.Predef._

class BasicLogin extends Simulation {
    val baseURL="https://blah.mwclearning.com"
    val httpProtocol = http
        .baseURL(baseURL)
        .acceptHeader("application/json, text/plain, */*")
        .acceptEncodingHeader("gzip, deflate")
        .acceptLanguageHeader("en-US,en;q=0.5")
        .userAgentHeader("Mozilla/5.0 (Macintosh; Intel Mac OS X 10.11; rv:43.0) Gecko/20100101 Firefox/43.0")
    def authHeader (auth_token:String):Map[String, String] = {
        Map("Authorization" -> "Bearer ".concat(auth_token), "Origin" -> baseURL)
    } 

    val answer_chain = exec(http("an_answer")
        .get(uri1 + "/information-requests/${item}/stores/answers")
        .headers(authHeader("${auth_token}")).check(status.is(200), jsonPath("$..status")))
    
    val scn = scenario("BasicLogin")
    .exec(http("get_web_app_deps")
     //... bunch of get requests for JS CSS etc
    .exec(http("login-with-creds")
        .post("/cm/login")
        .body(RawFileBody("test_user_creds.txt"))
           .check(headerRegex("Set-Cookie", "access_token=(.*);Version=*").saveAs("auth_token"))
    //... another bunch of get for post auth deps
        http("list_irs")
            .get(uri1 + "/information-requests")
            .headers(authHeader("${auth_token}")).check(status.is(200), jsonPath("$..id").findAll.saveAs("answer_ids"))
    //... now that we have a vector full of ids we can request those resources
    .foreach("${answer_ids}","item") { answer_chain }
    
  //... finally set the simulation params and assertions
    setUp(scn.inject(atOnceUsers(10))).protocols(httpProtocol).assertions(
        global.responseTime.max.lessThan(2000),
        global.successfulRequests.percent.greaterThan(99))
}

That’s about all I need to get started with Gatling! The next steps are:

  1. extending coverage (more tests!)
  2. putting processes in place to notify and act on identified issues
  3. refining tests to provide more information about the likely problem domain
  4. making a modular and maintainable test library that can be updated in one place to deal with changes to app
  5. aggregating results for trending and correlation with changes
  6. spin up and spin down environments specifically for load testing
  7. jenkins integration
Categories
ITOps

Getting started with Gatling – Part 1

With the need to do some more effective load testing I am getting started with Gatling. Why Gatling and not JMeter? I have not used either so I don’t have a valid opinion. I made my choice based on:

Working through the Gatling Quickstart

Next step is working through the basic doc: http://gatling.io/docs/2.2.1/quickstart.html#quickstart. Pretty simple and straightforward.

Moving on to the more advanced tutorial: http://gatling.io/docs/2.2.1/advanced_tutorial.html#advanced-tutorial. This included:

  • creating objects for process isolation
  • virtual users
  • dynamic data with Feeders and Checks
  • First usage of Gatling’s Expression Language (not rly a language o_O)

The most interesting function:

object Search {
    val feeder = csv("search.csv").random
    val search = exec(http("Home")
                .get("/"))
                .pause(1)
                .feed(feeder)
                .exec(http("Search")
                .get("/computers?f=${searchCriterion}")
                .check(css("a:contains('${searchComputerName}')", "href").saveAs("computerURL")))
                .pause(2)
                .exec(http("Select")
                .get("${computerURL}"))
                .pause(3)
}

…Simulation‘s are plain Scala classes so we can use all the power of the language if needed.

Next covered off the key concepts in Gatling:

  • Virtual User -> logical grouping of behaviours ie: Administrator(login, update user, add user, logout)
  • Scenario -> define Virtual Users behaviours ie: (login, update user, add user, logout)
  • Simulation -> is a description of the load test (group of scenarios, users – how many and what rampup)
  • Session -> Each virtual user is back by a Session this can allow for sharing of data between operations (see above)
  • Feeders -> Method for getting input data for tests ie: login values, search and response values
  • Checks -> Can verify HTTP response codes and capture elements of the response body
  • Assertions -> Define acceptance criteria (slower than x means failure)
  • Reports -> Aggregated output

Last review for today was of presentation by Stephane Landelle and Romain Sertelon,  the authors of Gatling:

Next step is to implement some test and figure out a good way to separate simulations/scenarios and reports.